Demand elasticity and policymakers in influencing transport use
| Subject: | 💻 Technology |
| Type: | Informative Essay |
| Pages: | 4 |
| Word count: | 1059 |
| Topics: | Transportation, 🚗 Electric Cars |

essay ASAP?
Mobility is integral to human existence, particularly in busy regions like towns. Public transport services are usually provided by both the public and private sectors; these services typically have high operating costs and require substantial investments (Polat, 2012). Accordingly, issues like efficiency and service productivity public transport demand (Paulley et al., 2006; Fouquet, 2012). The following discussion reveals the ability of policymakers to control transport use, as evidenced by demand elasticity values.
The impacts that change in the transport system may have on people’s mobility are referred to as sensitivity or responsiveness to a particular factor or variable that is measured through elasticities. Elasticities can be conceptualized as unitless ratios that can be used to measure a broad range of impacts (Peric and Strumberger, 2002; Litman, 2013). Some common ratios in the transport industries include the elasticity of car mode split regarding the percentage of public transport and automobile travel period for specific types of trips. Second, the motor mode split regarding the proportion of public transport fares and automobile operating costs (Litman, 2013). The elasticity of family unit vehicle uses and per capita possession regarding the quality of public transportation service in a neighbourhood is also a ratio in the transport industry.

Some elasticities only apply to the transport industry. Public transportation service elasticity shows the percentage shift in the public transport investment that is derived from a proportionate shift in public-transport service-kilometres. Furthermore, travel speed elasticity reflects the percentage shift in travel, which is the product of a proportionate shift in the travel speed for such trips (Litman, 2017). Elasticities may also be categorized by time-frame and the good that is being put into consideration. Accordingly, two of the most common types of elasticities comprise price elasticity of demand and income elasticity of demand. The former elasticity is conceptualized as the proportionate shift in the use of a particular good due to a change in the price of that commodity (Litman, 2013). The latter elasticity is conceptualized as a percentage shift in the use of a particular good due to a shift in the income of consumers.
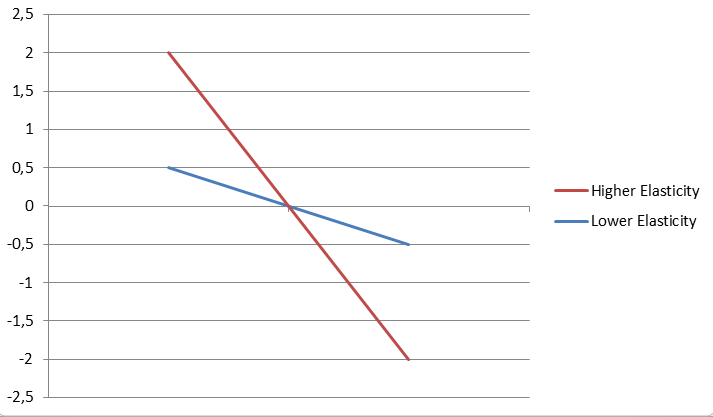
With the above considered, price sensitivity may be used to understand the changes that take place in the market. Price elasticities, which is also referred to as responsiveness or sensitivity, reflect the steepness of a demand curve (Litman, 2013). High sensitivity (gradual curve) is indicative of a relatively significant shift in travel activity while low sensitivity indicates a small change in travel. The sharpness of demand curve reflects the simplicity with which consumers can shift their consumption behaviours (Litman, 2013). For example, if public transport travel can be deemed comfortable and convenient, a small increase in parking fees is likely to cause a substantial number of travellers to move away from driving to using public transport.
With the above presumptions considered, policymakers can influence transport use in various ways. Different factors affect car elasticity values; they may include income, car ownership, and fuel consumption. Research has revealed multiple factors that influence car ownership; they include income, household demographics, and location (ATAP, 2017). The U.S. and U.K. travel industries show that population density, fuel prices, income, and other taxes have a direct correlation with per capita car ownership. For example, studies indicate that a 10% increase in fuel prices is likely to reduce vehicle possession by about 1% in the short-term and 2.5% in the long-term (Litman, 2013). Accordingly, long-term elasticities are more significant than short-term by factors of about 2 to 3. Also, research indicates that vehicle travel demand has heightened in the majority of the industrialized nations. Accordingly, vehicle travel may become more price responsive, especially if the quality of the alternative means of transport perks up.


Graph 1: Price Sensitivity
Car ownership has also been documented to correlate with car ownership. As households increase, their income levels, the rates of car ownership increase and vice-versa. In the same vein, if the cycling and walking conditions are poor and driving becomes a more viable transport solution, more households tend to own automobiles (Bacombe, Mackett and Pauley, 2004). Income elasticities are also higher than price elasticities by factors of 1.5 to 3. Furthermore, if real income increases by about 10%, some events ensue. First, the number of cars and the fuel that they guzzle increases by about 4% in 1 year and by about 10% after an extended period (Litman, 2013). Second, traffic volume is likely to go up by about 2% in the short term and approximately 5% in the long-run (Litman, 2013), which indicates that the extra cars are used less than the average mileage.
Fuel price increases also tend to result in a decline in fuel consumption in the short-run and increase the fuel economy in the long-run. Fuel price increases reduce the total transport speeds and vehicle mileage (Rodrigue and Notteboom, 2017). This phenomenon also leads to changes people’s preference to travel using the vehicles that are more fuel-efficient in the multi-vehicle homes (Cervero, 2011). In the long-run, fuel increases cause improvements in the fuel economy and improve people’s access to land. On the other hand, if fuel costs are low, car owners are inclined to prefer using enhancements in car efficiency to boost car performance instead of improving fuel economy. Studies indicate that the impacts of fuel prices on fuel consumption and fuel price elasticities range between -0.25 in the short-term and -0.7 in the longer run (Litman, 2013). Research indicates that a 10% increase in price is likely to result in a decline of about 1.5% in the short-run and one of about 2.7# in the long-run. In the long-run, vehicle travels are expected to decline by a margin of between 3 and 5% (Litman, 2013). Petroleum consumption may also decrease by about 7%.
Table 1.1: Table Showing Transport Elasticities
| Short-run | Long-run | |
| Petrol Consumption | -0.27 | -0.71 |
| Traffic levels | -0.16 | -0.33 |
| Bus demand | -0.28 | -0.55 |
| Railway demand | -0.65 | -1.08 |
Source: (Litman, 2013)
In a recap of the above discussion, demand elasticity values can reveal how policymakers control transport use. Movement is an integral part of people’s existence, particularly in busy regions like cities. Public transport services usually have high operating costs and require substantial investments. Accordingly, the policies that affect efficiency and service productivity in public transport demand determine how people use transport services, as discussed above.
- ATAP, 2017. Model design. Atap.gov.au. [online] Available at: https://atap.gov.au/tools-techniques/travel-demand-modelling/3-model.aspx [Accessed 23 Nov. 2017].
- Bacombe, R., Mackett, R., and Pauley, N., 2004. The Demand for Public Transport. TRPA. [online] Available at: http://www.trpa.org/documents/rseis/New%20References%20for%20Final%20EIS/Balcombe%20et%20al%202004.pdf [Accessed 23 Nov. 2017].
- Cervero, R., 2011. Beyond Travel Time Savings: An Expanded Framework For Evaluating Urban Transport Projects. World Bank. [online] Available at: http://siteresources.worldbank.org/INTTRANSPORT/Resources/336291-1239112757744/5997693-1294344242332/Traveltimesaving.pdf [Accessed 23 Nov. 2017].
- Fouquet, R., 2012. Trends in income and price elasticities of transport demand (1850–2010). Energy Policy, 50, pp.62-71.
- Litman, T., 2017. Understanding Transport Demands and Elasticities How Prices and Other Factors Affect Travel Behavior. Victoria Transport Policy Institute. [online] Available at: http://www.vtpi.org/elasticities.pdf [Accessed 23 Nov. 2017].
- Litman, T., 2013. Transport Elasticities: Impacts on Travel Behavior. Victoria Transport Policy Institute. [online] Available at: http://www.sutp.org/files/contents/documents/resources/B_Technical-Documents/GIZ_SUTP_TD11_Transport-Elasticities_EN.pdf [Accessed 23 Nov. 2017].
- Paulley, N., Balcombe, R., Mackett, R., Titheridge, H., Preston, J., Wardman, M., Shires, J. and White, P., 2006. The demand for public transport: The effects of fares, quality of service, income and car ownership. Transport Policy, 13(4), pp.295-306.
- Peric, T. and Strumberger, N., 2002. Demand Elasticity on The Transport Market. [online] 14(5). Available at: http://www.fpz.unizg.hr/traffic/index.php/PROMTT/article/viewFile/1034/881 [Accessed 23 Nov. 2017].
- Polat, C., 2012. The Demand Determinants for Urban Public Transport Services: A Review of the Literature. Journal of Applied Sciences, 12(12), pp.1211-1231.
- Rodrigue, D. and Notteboom, D., 2017. Transport Supply and Demand. People.hofstra.edu.[online]. Available at: https://people.hofstra.edu/geotrans/eng/ch7en/conc7en/ch7c4en.html [Accessed 23 Nov. 2017].

Offered for reference purposes only.