Change in demand for oil
| Subject: | 💻 Technology |
| Type: | Analytical Essay |
| Pages: | 8 |
| Word count: | 1607 |
| Topics: | 🚗 Electric Cars, Transportation, 💵 Finance, 💳 Microeconomics |

essay ASAP?
Table of Contents
Introduction
Oil is one of the most used commodities in the world as it’s not only processed to be used as fuel but also utilized in diversified manufacturing industries such as the production of petroleum products like paper bags. Due to this characteristic of it being used for multiple functions, its demand tends to continue to rise especially now with the global oil reserves dwindling. In addition to that, since oil has been in constant demand for decades we must consider what economic implications this demand has brought about. Therefore, in my economic analysis of change in demand for oil over the past decade, I will seek to analyze and see the economic impact brought onto our economy, as well as critical analyze how sectors that are dependent on oil such as car manufacture industry have adapted to the increasing prices of oil due to demand (Mouawad, 2007).
Effect of Demand of Oil on the Economy
Oil is constantly on demand, however, at times there are periods when the demand is higher or lower than other times. This demand is usually caused by shortages or oversupply. In both situations, the change in demand has an effect on our economy whether positive or negative. To better explain such effect, I will introduce the microeconomic theory of supply and demand.
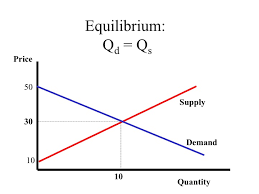
At times the supply of oil is just sufficient meeting all the demand it requires to, hence the market is at equilibrium as seen in Figure 1 below. Such cases though rare are said to be good economic periods, as the price of oil would be at a moderate amount that’s affordable, hence also commodities that heavily rely on oil for manufacturing, processing or to operate are able to reduce the production or operation cost (Arnold, 2016). A common example would be on a micro level where households depend on oil products such as petroleum to operate cars with, if supply and demand is at equilibrium then households will enjoy a period of good petroleum prices.
Figure 1: Equilibrium Supply and Demand of Oil


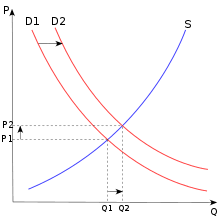
When the supply of oil does not meet demand, for instance during the month of September the Southern Coastal States of the United States were rocked with two major hurricanes, Hurricane Irma and Hurricane Harvey, during this period of devastation, demand for oil and oil products was high. In such a case the demand curve would shift to the right, from D1 to D2 as you can see on the graph in Figure 2. This higher demand would result in an adverse effect on the economy as prices would increase on any product, operations, etc. that required oil from P1 to P2. For example if, during the period of the hurricanes residents wanted to evacuate but since demand for petroleum a product of oil was high, the prices also were high. Furthermore, the fact that some places were in the path of the storm hence limited new supply of petroleum so the demand grows as supplies dwindled consequently causing the prices to rise even higher. Hence, one can clearly see that rise in demand for oil has an adverse effect on the economy (Arnold, 2016).
Figure 2: High Demand, Low Supply
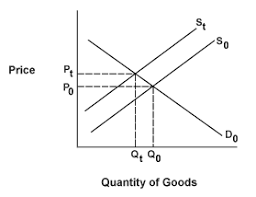
During rare occasions, demand for oil decreases, this can be as a result of oversupply in the market hence the supply being more than the demand. Therefore, on the graph the supply curve shifts from St to So as seen in Figure 3 below. In such cases, the effect has a positive outcome on the economy since reduction of price of oil consequently causes reduction of prices in industries that are reliant on oil to operate, manufacture or process commodities.
Figure 3: High Supply, Low Demand
This basic analysis is relevant for the past decade concerning supply and demand for oil, in that for the past decade, when demand of oil was high prices of oil product rose consequently causing an adverse effect on the micro-economy, since commodities became more expensive, however when demand was low, the economy benefited with lower prices as business operations, as well as household operations were able to run smoothly with less operational cost.


More Fuel-Efficient Vehicles and New Technology
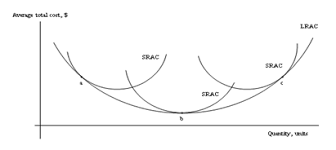
The industry that is most affected by the demand for oil is the vehicle manufacturing industry this is inclusive of cars, buses, trains, ships, planes or any mobile machine that requires fuel. This is mainly because oil is used to produce fuel that is used to run the vehicles. Over the decade’s demand of oil has been on the rise, the main cause is due to the production of more and more vehicles that require fuel to run as well as dwindling reserves of oil. This demand has caused high prices that have reached levels which are not affordable to every household. Hence, the car manufacturing industry has had to adapt to this situation by producing more efficient vehicles that consume fewer fuels as well as emit fewer pollutant gases. For this car manufacturing industries has to invest in modern technology to help them produce such cars. The modern technology helps them to reduce production cost in the long run period by reducing any fixed cost as seen below in Figure 4.
Figure 4: Cost of Production Long Run Period
For example, such modern technology helps in producing a modern ECO-Engine that uses Valve-Matic technology to utilize less and less fuel for cars. Furthermore, car manufacturing companies like Tesla has been producing quality fully electric cars that do not require fuel (Eberhard and Tarpenning, 2006). Such cars are more consumer friendly since they require less, or no fuel hence demand of oil effect on them is less (Arnold, 2016).
Travel by Car, Train or Air
People have to travel, whether it is for work, vacation, to get to the hospital and many more reasons. However, there are diversified ways in which one can travel, by road, rail or air being the main three. However, due to the constantly changing demand for oil that directly affects these mediums of travel one has to choose the means by which they will derive maximum utility for the least amount of money spent. Mainly what matters in such a situation is one’s income, since one can move from point A to B by use of any of the three mediums.
As consumers, we are expected to make the rational decision or choice. From figure 5 below we see three indifference curve. Let us assume that a train is the cheapest means to travel from point A to B then followed by a car than plane, represented by IC1, IC2, and IC3 respectively.
Figure 5: Shifting Indifference Curve
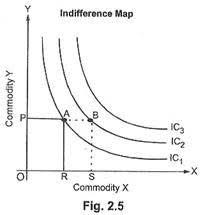
A rational consumer would use the train to always travel between point A and B so as to maximize the utility of his/her money. However let’s say that the said consumer got a raise in income, due to that then he/she would only be rational to move to IC2 so as to maximize the utility of the comfort of his/her own car without being cramped in a train with many people. If he/she got a further raise then it would be only rational for the consumer to utilize IC3 for comfort and timely travel. Hence, in this situation the demand for oil would force a person to travel by a means he/she would derive maximum utility in accordance with their income (Kreps, 1990).

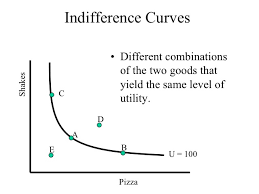
Also, according to consumer behavior in microeconomics, one can also move along an indifference curve. In the above example take an individual that has a car but the more rational decision so as to, maximize utility due to the high cost of petroleum due to rising oil prices is to travel by train. However, this is not the only solution for the individual as one can move along an indifference curve so as to make sure he/she derives maximum utility. For example in figure 6 below, A consumer can choose to move along the indifference curve of using a car to move between points A and B by sacrificing the comfort of being in his car alone and carpooling with people so as to save on gas cost, hence deriving maximum utility (Kreps, 1990).
Figure 6: Moving Along Indifference Curve
Conclusion
Notably, as we have seen, demand for oil in the past decade has been on the rise due to several factors. This demand has caused diversified effects to the economy, mainly raising expenses of oil produced commodities and transport since oil is used primarily in those two sectors (Fournier et al., 2013). Furthermore, due to this demand more and more people are choosing public means of transport such as trains and buses which are cheaper than buying or using their own car. Also, carpooling has become a household word as more people engage in it so as to save money due to the high cost of fuel. In conclusion, we clearly see that the demand for oil has had a large effect on our economy, hence consumers should try to not be fully reliant on oil products due to the high demand that’s causing high prices.
- Arnold, R. (2016). Microeconomics. 12th ed. Boston, MA: Cengage Learning
- Eberhard, M., & Tarpenning, M. (2006). The 21 st Century Electric Car Tesla Motors. Tesla Motors.
- Fournier, J. M., Koske, I., Wanner, I., & Zipperer, V. (2013). The Price of Oil–Will it Start Rising Again?.
- Kreps, D. M. (1990). A course in microeconomic theory (Vol. 41). Princeton, NJ: Princeton university press.
- Mouawad, J. (2007). Rising demand for oil provokes new energy crisis. The New York Times.

Offered for reference purposes only.